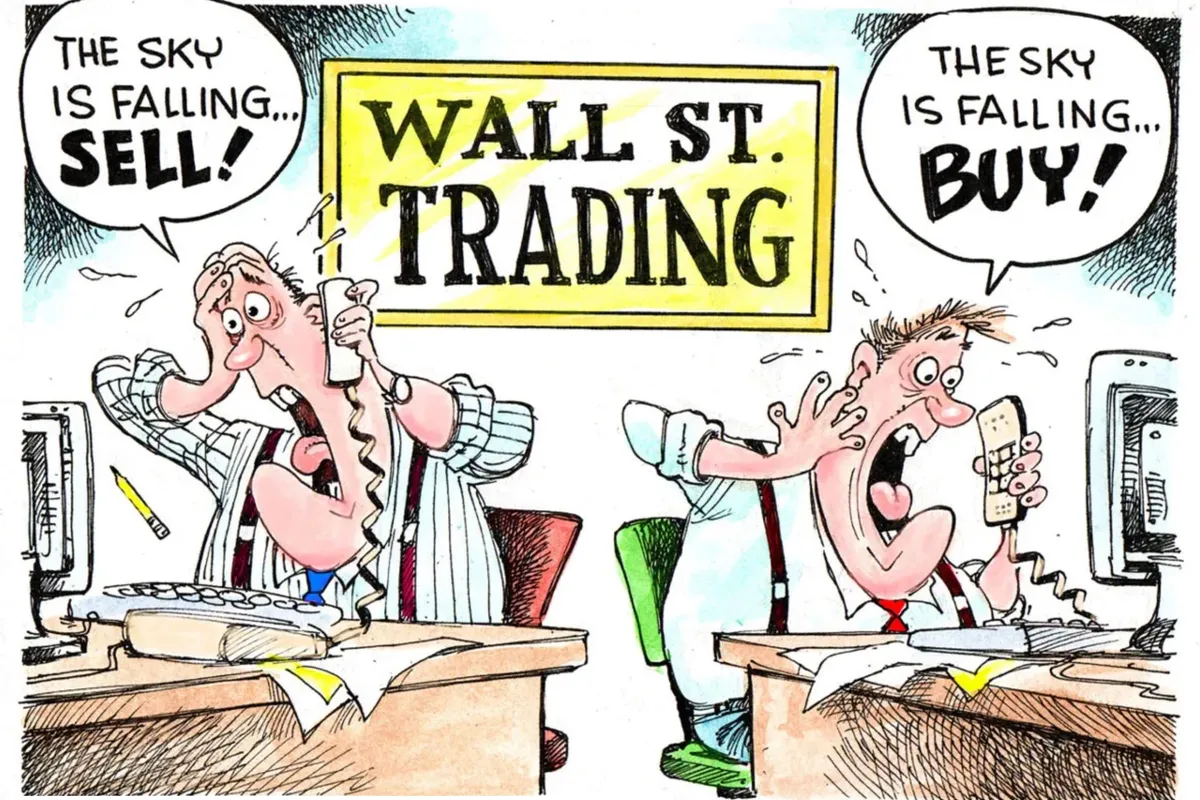
The Unluckiest Investor Ever. What Happened to Money Invested in September 1929?
Quick quiz. Imagine you invested a lump sum in U.S. stocks in September 1929, the month before the crash that kicked off the Great Depression. You never sold and never added money, and you reinvested every dividend. Thirty years later, what was your annualized return?
- A) -1.5%
- B) 0.8%
- C) 3.8%
- D) 7.8%
Most people guess somewhere between "wiped out" and "barely broke even."
The answer is D. The 1929-peak investor compounded at about 7.8% a year (nominal, dividends reinvested) over those 30 years. That's close to the long-run average for U.S. stocks.
What that investor lived through
Over those 30 years, the same portfolio sat through an equity collapse of roughly 85% (the Dow's own peak-to-trough decline was about 89%), a decade of deflation, World War II, the inflation of the 1940s and the Korean War. It still compounded at a healthy rate.
Two caveats matter:
- It's a total-return number. Dividends were a large share of the return in that era. Price-only, the result looks far worse, so any "buy and hold" claim has to say which one it means.
- The "S&P 500" didn't exist in 1929. The 500-stock index launched in 1957. Earlier figures come from the S&P Composite (90 stocks) or reconstructed series.
Volatility fades with time. Wealth outcomes don't.
It's tempting to conclude that time "removes" risk. It's more accurate to say that time narrows the range of annualized returns.
I checked this against monthly S&P 500 data from January 1957 to October 2026 (price only, monthly closes):
- Worst single 12-month return: -44.8% (Feb 2008 to Feb 2009)
- Best single 12-month return: +53.7%
- Worst annualized 10-year return: -5.1%
- Best annualized 10-year return: +16.8%
- Worst annualized 30-year return: +5.5% (Dec 1958 to Dec 1988)
- Best annualized 30-year return: +10.5%
A one-year investor faced a range of nearly 100 percentage points. A 30-year investor faced a range of about 5. And these are price returns, so dividends would push every 30-year figure higher.
Two honest limits: the 30-year windows overlap heavily, so there are only a couple of truly independent ones in the data. And this is the U.S., a market that happened to do well. Other countries' stock markets had far worse 30-year stretches.
The worst 30 years you can actually check
The 1929 numbers come from reconstructed historical series. If you'd rather test the idea against clean S&P 500 data, the worst 30-year window since 1957 started in December 1958 and ended in December 1988. That investor sat through the 1973-74 bear market, a decade of 1970s stagflation, the Cold War and Black Monday in 1987 (the index fell about 30% from August to November that year on monthly closes). They never sold, and they still compounded at 5.5% a year in price alone, before dividends.
Here's the fair caveat: that's a nominal figure, and inflation ran at roughly 4% to 5% a year over that stretch. In real price terms that investor was close to flat, and dividends did most of the work of making the real return positive. So time did heal the drawdown, but slowly, and not for free. The right lesson isn't that stocks always pay off. It's that even the worst 30-year stretch in the modern data didn't end in ruin for someone who stayed invested.
The real threat: sequence of return risk
The 1929 investor's story works because they never had to sell. Time healed the drawdown because nothing interrupted it.
Sequence of return risk (SORR) is what happens when you do have to sell. If you're taking withdrawals, paying a tax bill, meeting a debt payment or answering a capital call while prices are down, you're selling more shares to raise the same cash. Those shares aren't there to participate in the recovery. The average return can be identical, but the order of returns decides how much wealth you end up with.
The scale of the drawdowns is worth remembering. From the same dataset:
- 2008 was a calendar-year loss of -38.5%, but that isn't the worst of it. From the October 2007 peak to the February 2009 trough, the index fell 52.6% on monthly closes. Daily closes show a slightly deeper trough of about 57%.
- It took until March 2013, about five and a half years, for the index to climb back above its October 2007 level (price only).
- Anyone who bought near the 2000 peak waited until the same month, March 2013, to be back above water in price terms, about 12 years.
An investor who was still holding was fine. An investor who needed to withdraw during those years had a very different outcome.
What to do about it
You don't need to abandon stocks for low-yield bonds. You need to make sure you're never forced to sell stocks at the bottom. A few common ways to do that:
- Hold a cash reserve for one to three years of planned spending in cash, T-bills or a high-interest savings account.
- Build a bond or GIC ladder whose maturities line up with known near-term expenses.
- Use a bucket strategy. Near-term needs sit in safe assets, long-term money sits in equities, and you refill the safe bucket from gains in good years.
- Keep flexibility in spending. Being able to trim withdrawals in bad years is worth a lot.
- Consider guaranteed income (such as annuities or pensions) for essential expenses, if the cost and terms suit you.
The common thread is separating money you need soon from money you won't touch for decades. The first has to be stable. The second can ride out the cycles.
The Takeaway
Stocks have been a reliable compounding engine over multi-decade horizons, even for the unluckiest investor in modern history. But that result belongs to people who stayed invested. The question to ask isn't "will the market recover?" It's "will I be forced to sell before it does?"
This post is for education, not financial advice. Past performance doesn't guarantee future results.
SERVICES FINANCIERS ARMSTRONG INC.
Cabinet en assurance de personnes
ARMSTRONG FINANCIAL SERVICES INC.
Firm in the insurance of persons
Disclaimer: This material is provided for educational and informational purposes only and does not constitute legal, tax, accounting, or financial advice. The application of financial, legal, and tax laws is highly complex, subject to change, and depends heavily on individual circumstances. Readers should not act upon this information without seeking independent, qualified professional counsel tailored to their specific situation. The author assumes no liability for any errors, omissions, or damages arising from reliance on this content. Reviewing this material does not establish an advisor-client relationship. © 2026 Armstrong Financial Services Inc.
← Back to articles